Fundamentals & Technicals Lining Up for Gold Prices to Skyrocket
The fundamentals of the gold market remain solid and continue to make a case for a $3,000-an-ounce gold price. However, it’s time to start paying attention to the gold price charts. The charts aligning with the fundamentals paint a bullish picture.
Before going into any details, here’s a little overview of what’s been happening in the gold market from a fundamental-analysis perspective:
Advertisement

- Central banks have been buying gold, and it doesn’t look like they’ll stop anytime soon
- Mints around the world have been reporting robust gold sales
- Gold-backed exchange-traded funds (ETFs) continue to hold and buy immense amounts of gold
- Uncertainty about the global economy has been increasing
- Major economic hubs have been struggling to report growth
- Fiat currencies are being questioned
- Gold discoveries have been falling off a cliff
- The gold production outlook isn’t as rosy as before
All of these factors suggest that the price of gold could be setting up for a big move to the upside.
A classic economic situation could play out in the gold market: demand increasing, supply flattening/decreasing, and gold prices eventually skyrocketing.
Short-Term Gold Price Outlook: Possible 11% Upside
Looking at the daily gold price chart, there’s one factor that says gold prices could make big gains in the near term.
You see, technical analysts pay attention to crossovers of moving averages, more specifically when a short-term moving average crosses above a long-term moving average. Generally, when this happens, you see a move to the upside in the asset’s price. Analysts refer to this pattern as a “golden crossover.”
Not too long ago, the 50-day moving average of the gold price crossed above its 200-day moving average. This is a bullish sign. For some perspective, the last time there was a golden crossover like this, gold prices increased by roughly 11% a few months later.
Assuming something similar plays out again, we could be looking at a gold price around $2,271 per ounce in the coming months. This would put the price of the yellow precious metal in record-high territory.
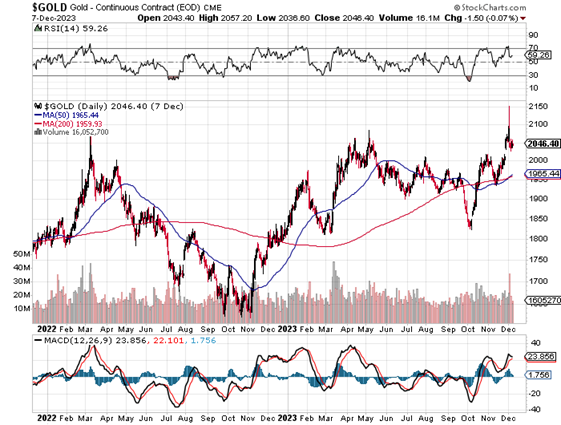
Chart courtesy of StockCharts.com
If This Chart Pattern Plays Out, It Could Mean 25% Higher Gold Price
Looking at the longer-term view of the price of gold…
Over the past few years, gold prices have been forming a technical chart pattern called an “ascending triangle.” This pattern forms when there’s a prevalent uptrend that finds consistent resistance. Technical analysts get excited when a price breaks out above a resistance level.
Not too long ago, the price of gold briefly broke out above a resistance level but quickly came down. Will gold prices test their recent highs again? If yes, then the precious metal is going to be extremely bullish.
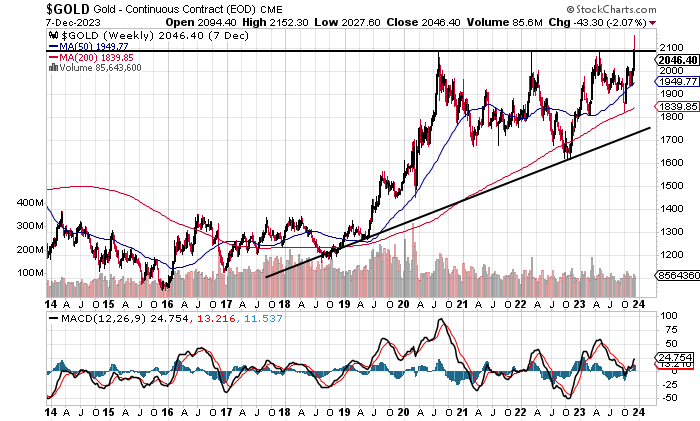
Chart courtesy of StockCharts.com
Moreover, there are usually targets associated with chart patterns. Usually, technical analysts set the targets by measuring the widest part of the triangle and then adding it to the breakout point.
In the case of gold, the widest part of the ascending triangle is the price action between April and October 2022; it’s about $450.00 wide. The major resistance level is around $2,100.
So, if the charts play out as expected, we could see gold prices as high as $2,550 per ounce. That’s roughly 25% above the current price.
Where’s the Opportunity When the Gold Price Skyrockets?
Dear reader, I believe that gold remains undervalued, and investors are starting to sense it. The gold charts are now showing bullish sentiment build up.
I remain bullish on gold prices going into 2024. I think there’s a good chance that gold will beat many other assets in the new year. But I also want to preach a little bit of caution. If there’s some sort of liquidity event in the financial world, gold could get sold. If this happens, it will be a blessing in disguise.
Where’s the opportunity? I believe it’s important to pay close attention to shares of gold mining companies. They’ve been overlooked, and they may have to do a lot of catching up to the gold price.
Not all mining companies are great, but a decent number of them have built decent operations, produced more gold at a lower cost, and strengthened their balance sheets. Mining stocks could provide returns that are leveraged to gold prices.